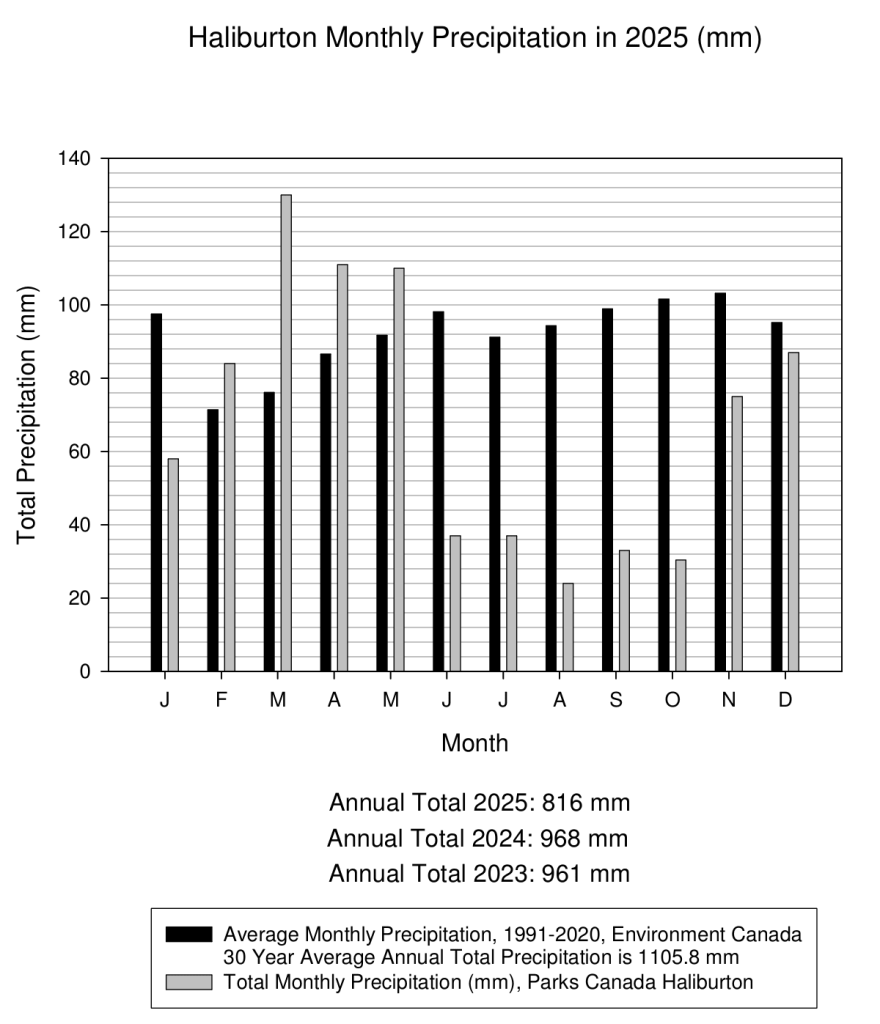
CEWF keeps track of precipitation data and the chart below demonstrates how extreme 2025 was.
Precipitation from February until May was well above normal; and precipitation from June to October was extremely low. These conditions led to major challenges for both the TSW and property owners. It was a roller coaster!
The precipitation data is outlined in the following graph, and its detailed explanation follows. Data table is available by clicking [here]
Detailed explanation:
Last winter we had an above-average snowpack. We then had significant rain and warmer temperatures on top of that snowpack. This resulted in an intense spring runoff with elevated concern for flooding. Thankfully, TSW operations had lake levels and flows near normal by late May, in time for the opening of the Waterway. After that, however, TSW briefly closed sections of the Waterway due to high flows resulting from significant late-May rainfall. The high flows caused conditions that were dangerous for boat traffic. The closure of the Waterway reduced flooding potential by letting water flow freely out of the system by temporarily increasing downstream flows at dams. That was fine until summer came…
From June until October rainfall was well below normal and the hot, dry weather meant that TSW had to conserve what little water there was. They did this by reducing flows to support downstream municipal water needs. As a result, the reservoir lakes were below their normal levels by late summer. Winter set logs were in place by early October and, to maintain minimum flow and support navigation, the Kawartha lakes were managed below normal levels through to mid-October.
Bottom line: it was a heck of year!
We continue to monitor snowfall, snowpack and other weather patterns to keep you informed.