this is a long post. Click on the title or [here] to expand.
IMPORTANT
PROPERTY OWNERS NEED TO BE AWARE OF UNUSUALLY LOW WATER LEVELS AND PLAN ACCORDINGLY
Water Levels through out the reservoir area are very low for the date. In most cases our levels are what we would expect in early to mid-September. As a result, we need to be ready to take our fall shoreline management very seriously several weeks early this year. This could mean moving docks and water lines and taking boats out of the water early.
Our lakes and the entire Trent System were at normal full levels in June. But we then had very dry conditions with less than 40% of normal rainfall in both June and July. In August, we have seen almost no rainfall except for some localized thunderstorms. These conditions have prevailed over the entire Trent Basin from the top of Haliburton to Lake Ontario. The hot temperatures have also resulted in higher than normal evaporation losses from the system. The last time we saw such an extreme season was in 2012. The TSW Water Management Team is fully engaged in managing water levels and flows to conserve as much water as possible; and CEWF is regularly speaking directly to the Team to share and receive pertinent information.
Under normal conditions, about 75% of the system’s flow comes from the reservoir lakes. Since Late June TSW has been managing the entire system to conserve water. TSW must maintain minimum flows to support municipal water supply at Peterborough, and to maintain minimum depths and flows for navigation on the Waterway. The lack of rainfall in June meant the reservoir drawdown began early, at the end of June. It's important to note that when the Waterway is operated at minimum flow levels for the Peterborough water supply, it does not require more water for the Canal. The means our water loss is primarily for downstream water supply, not for the Canal. The other substantive loss of water is evaporation from the lakes which has been higher than normal with the exceptionally hot summer.
TSW has been conserving water throughout the system and will continue to do so. Currently, the levels in the large Kawartha Lakes are being lowered while preserving minimum navigation depths in the Canal.
As of August 18 the reservoirs are only about 58% full. The flow at Peterborough is at the minimum and significant evaporation demand continues. Drawdown is continuing across all reservoirs.
This means that our lakes are significantly lower than expected on this date. In fact most of our lakes are running from 2 to 4 weeks ahead of our normal level pattern.
The bottom line is that residents must monitor their lake level changes and prepare to adjust their shoreline use accordingly.
If you’d like more details on how to monitor your lake’s levels, continue reading.
MONITORING WATER LEVEL CHANGES AND PROJECTIONS
TSW provides excellent information on current water levels and trends and forecasts. All this is easily viewed through links on the CEWF website at CEWF.ca
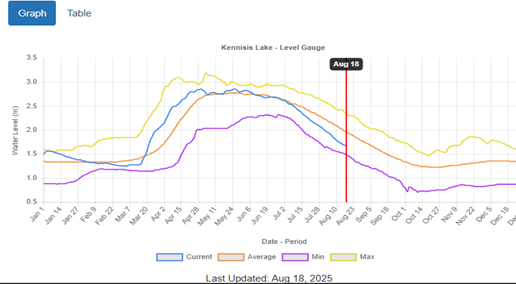
If you start with the “Live Water Levels” link on our home page you can access the graph and table for your lake. See example below.
On the water level graph you can see your current water level. You can also estimate how far ahead of your normal lake level drawdown you are by comparing the current date to the average line (brown line) date when your level would normally be this low. The Kennisis Lake example appears to indicate their current water level is about 20 days ahead of normal.
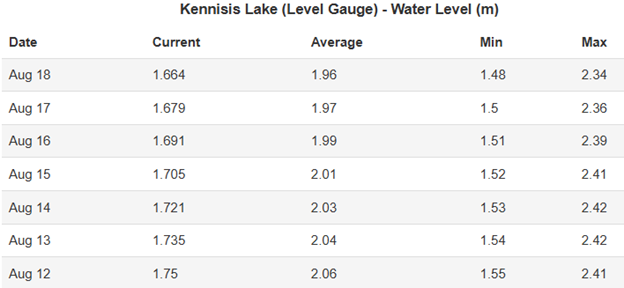
On the website you also have the option to click on the “Table” option. See second example below. The table shows the actual water level vs Average for the last 30 days. It allows you to see the day to day changes and appreciate how fast conditions are changing.
Live Water Level Graph Example
Water Level Table Example
Weekly Drawdown Forecast
The third Source of critical information is the weekly Drawdown Forecast which can be accessed through the “Drawdown Forecast” link on the CEWF website home page.
See the example below.
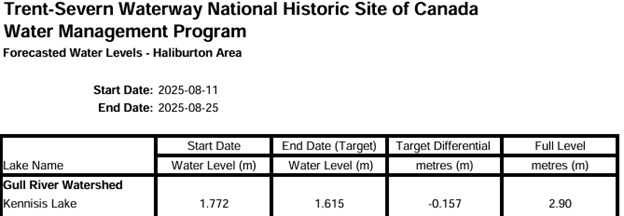
The Forecast table provides the projection for water level changes over the next 14 days and it is updated weekly. CEWF normally posts the updated forecast on Tuesdays.
It is a rolling forecast updated every week. If significant rainfall occurs it will likely change but otherwise it is a very good projection of the most extreme drop in level expected based on current water management plans.
SUMMARY
We are in an unusual period of low and dropping water levels. Shoreline residents need to be aware that low levels are well ahead of the normal dates for fall drawdown.. You must be ready to adjust your shoreline uses accordingly.
In the preceding paragraphs we have tried to illustrate how you can use TSW data posted on the CEWF website to get a clear picture of conditions on your lake and projected water level changes going forward.
Please consider subscribing to the CEWF Website using the button on our Home Page. As a subscriber we will send you a notice each time we post new information.